2. Configure fleets and freight costs
What you will build
Associate fleets, freight tables, and lanes and check each leg’s cost.
Before starting
Use the locations and service segmentation from the previous chapter. Define freight responsibility, transportation service, and billing units.
A fleet groups transportation alternatives with compatible capacities, vehicle types, and costs. A freight table belongs to a fleet and defines applicable prices. Transportation lanes are associated with the fleets allowed to operate them. This separation allows the same origins and destinations to use different services without confusing prices with capacity.
One possible organization, used in this template, is:
| Fleet | Example lanes | Freight table |
|---|---|---|
CIF-DEDICADO |
Plant → DC; plant → CIF customer | Dedicated rates by connection or distance band |
CIF-FRACIONADO |
DC → CIF region/customer | Less-than-truckload rates by connection or distance band |
FOB-DEDICADO |
Plant → FOB customer | Zero for the FOB delivery leg |
FOB-FRACIONADO |
DC → FOB region/customer | Zero for the FOB delivery leg |
Replenishing a DC incurs transfer freight even when the DC serves FOB demand. The zero-cost FOB fleets make this template's economic rule explicit; they do not mean the physical flow is absent.
Create the table header under its fleet, then its rates. For negotiated freight, enter prices by origin–destination connection; for a distance curve, use kilometer bands and the appropriate billing unit. Keep validity periods, units, and service types explicit. A cost per trip requires attention to vehicle capacity and integer trip counts; costs per tonne or volume/distance support a different formulation.
Other options are simplified lane costs, lane costs by material, and a logistics cost curve when enabled. They are documented in Logistics and location costs. These alternatives are outside this template's detailed scope. Before running, check which source actually takes precedence to avoid overriding a freight table with a forgotten simplified cost or counting the same freight twice.
Create records in dependency order
- Create the fleets listed above and identify the service mode of each one. Where capacity constraints or different vehicle types apply, preserve that separation in the records; the fleet name alone does not create a constraint.
- Create each freight-table header under its corresponding fleet. Check the association before entering prices: correct prices under the wrong fleet do not represent the intended service.
- Load prices by origin–destination connection or distance band, according to the study's chosen source. Check unit and validity. In this example's FOB tables, explicitly enter zero for delivery legs; do not use an absent table to represent that condition.
- Associate each transportation lane with an eligible fleet in the network version being studied. A lane may have alternatives, but they must retain compatible service, capacity, and economic rules.
- Select one lane from each service mode. Follow lane → fleet → table → price and reconcile it with the expected cost. Then check a plant → DC transfer that supplies FOB demand: this leg must remain costed.
Keep this sample for reconciliation after execution. An absent table does not establish zero freight, and a fleet without a lane association does not establish that its price will be used.
Maintain the records in Data
Open Data > Data Operations. For each topic, choose Download and Download as XLSX to inspect the structure and records. Prepare the change while preserving related dataset keys, return to the same topic, and choose Import. Download again after loading and check the relationships.
1. Fleets and lane coverage
In the catalog, follow Master Data > Supply Network > Fleet and Vehicles. Choose Fleet for the fleet master. The fleet identifies the service; vehicle types and availability, when used, are maintained under Vehicle Type and Available Vehicles by Fleet.
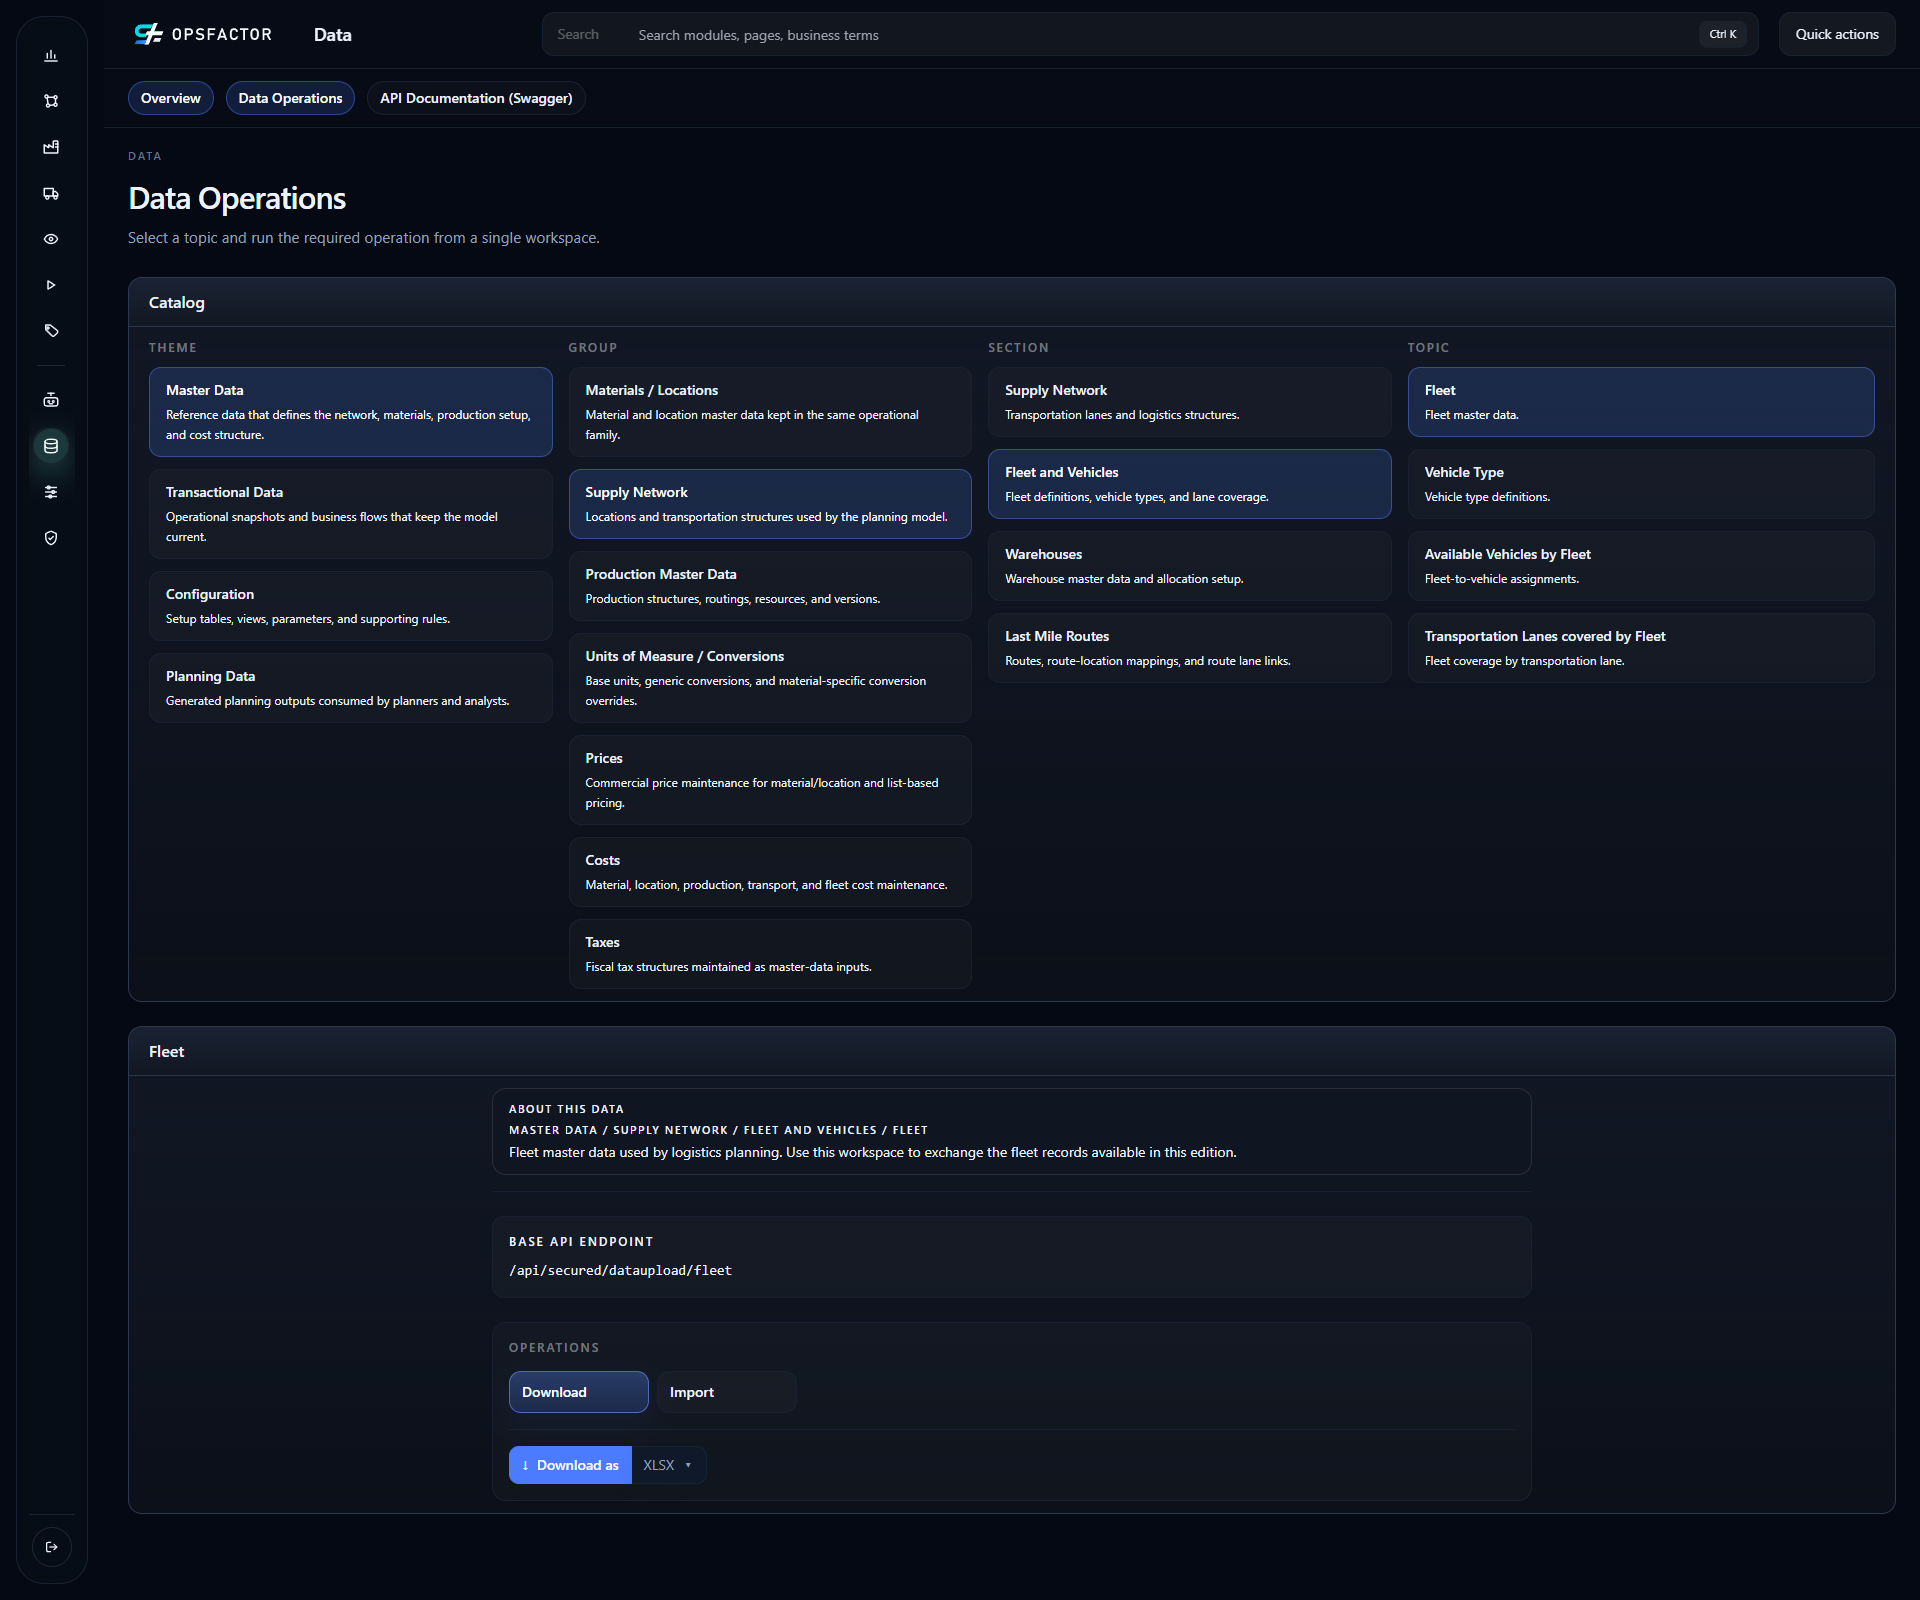
In the same section, choose Transportation Lanes covered by Fleet to associate fleets with lanes in each network version. Check network, origin, destination, and fleet: this relationship determines which services can run each connection. Creating a fleet does not automatically create its coverage.
2. Subordinate table header
Switch to Master Data > Costs > Fleet Costs > Fleet Freight Price Table. The header identifies the table within a fleet, with its effective dates and priority. Check the fleet before preparing child prices. Preserve the same table identifier in the corresponding price records.
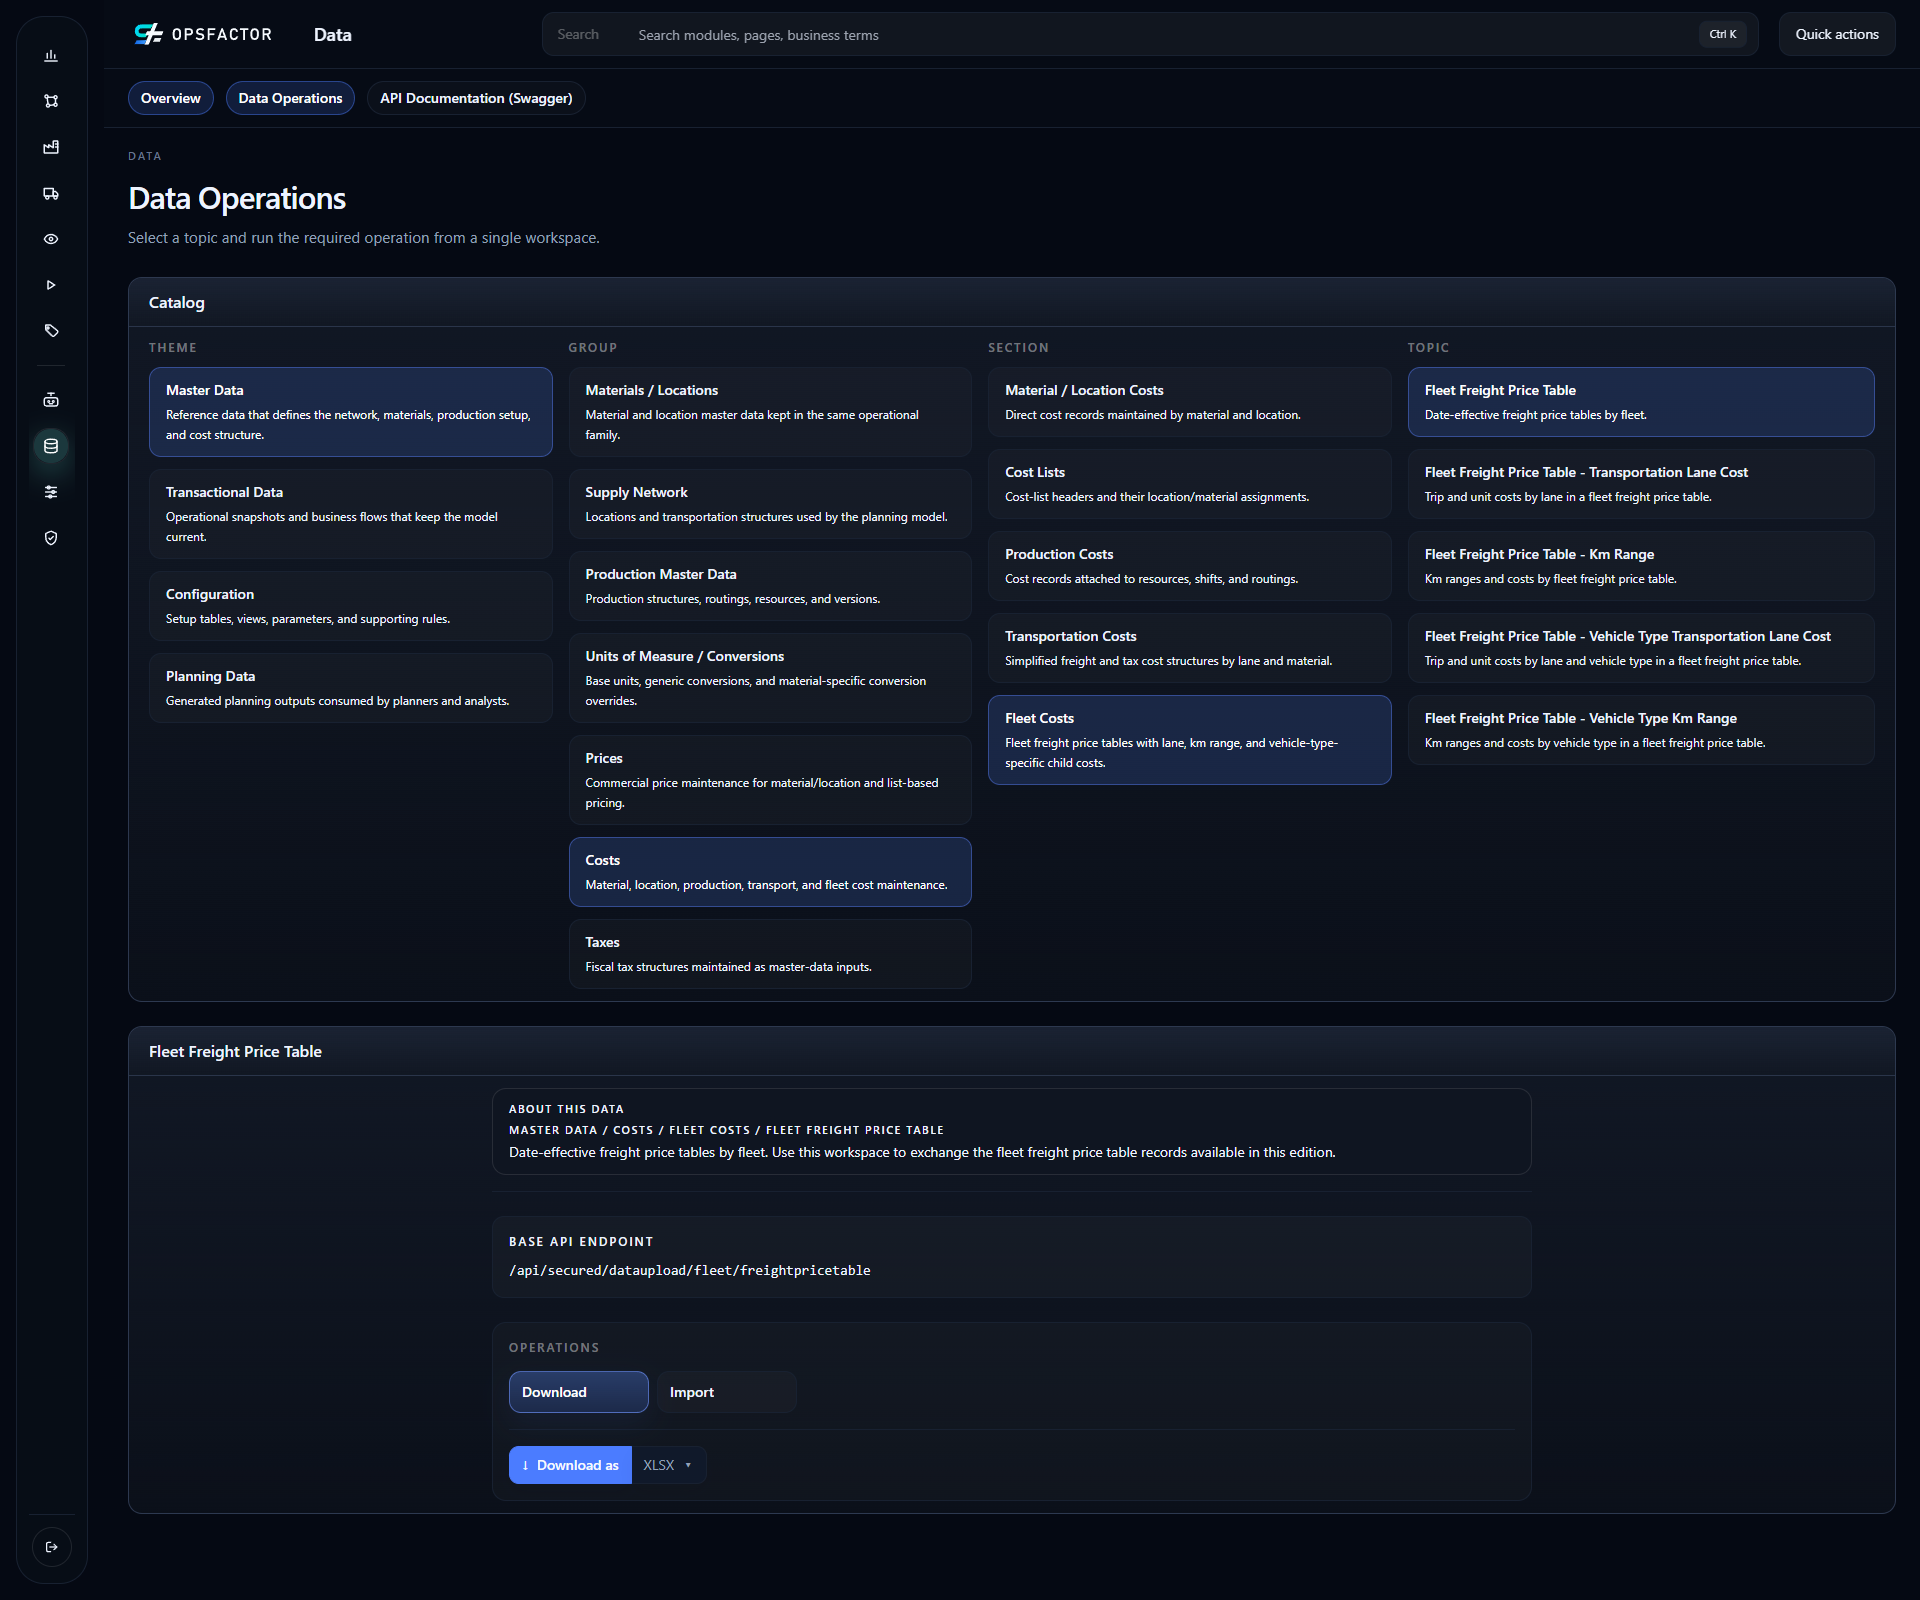
In the demonstrated scenario, each of the four fleets has a
TARIFA-DIDATICA header, effective from 2026 through 2040 with
Priority = 1. The identifier repeats because its key includes the fleet:
CIF-DEDICADO / TARIFA-DIDATICA and FOB-DEDICADO / TARIFA-DIDATICA
are distinct tables. This relationship was checked in the master-data export.
3. Prices by lane and distance
For negotiated origin–destination prices, choose Fleet Freight Price Table - Transportation Lane Cost. Check fleet, table, origin, destination, unit, and applicable cost components. A zero FOB delivery price is an explicit economic record, rather than an omitted row. The didactic FOB tables have Unit Cost = 0 and Trip Cost = 0, checked in the exported records. The final cost used by the plan is reconciled after execution.
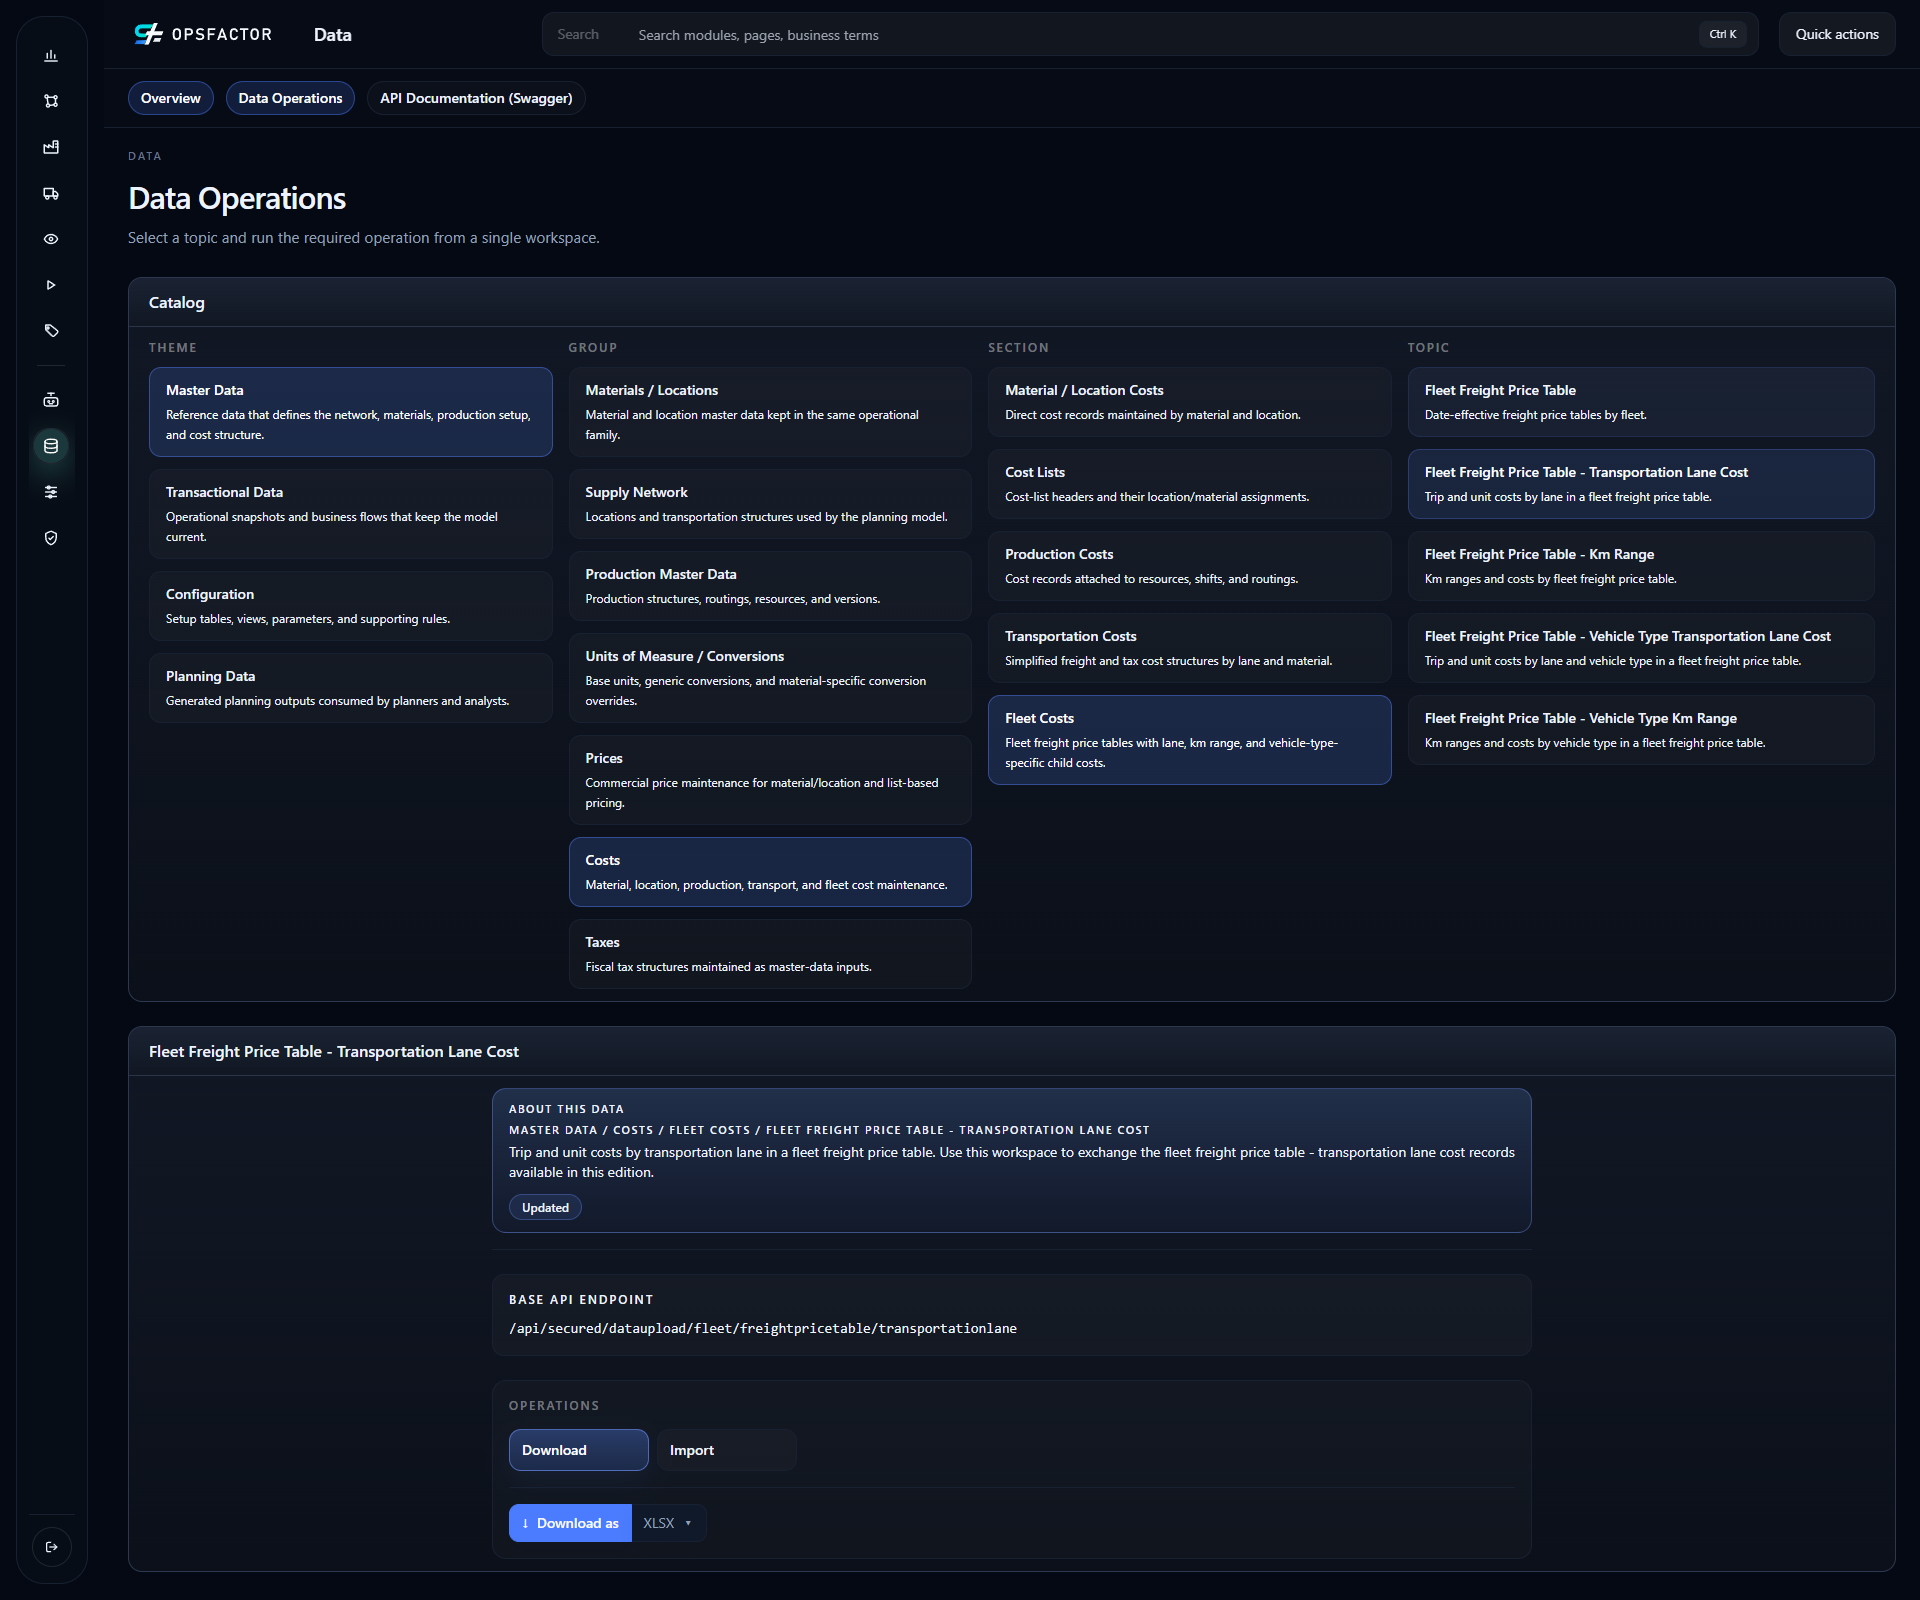
When prices are distance-based, use Fleet Freight Price Table - Km Range in the same section. An effective table is selected by priority; within that table, check the specific lane price and, where applicable, the distance range. Do not rely on a lower-priority table to silently fill a missing range. Reconcile the CIF, FOB, and transfer samples against the cost source actually selected.
Check three concrete prices from the scenario
The examples below are an explanatory table derived from verified records,
with unit costs rounded to six decimal places. All belong to
TARIFA-DIDATICA within the fleet shown; origin and destination keys let
you find the same lane in the downloads.
| Lane | Fleet | Unit cost per TON | Trip cost |
|---|---|---|---|
CD-030 → MUN-2362-CD-CIF |
CIF-FRACIONADO |
72.474486 | Not registered |
CD-NOVO-001 → MUN-2274-CD-FOB |
FOB-FRACIONADO |
0 | Explicit 0 |
The first lane belongs to the baseline. The second will be created in the brownfield network in chapter 5. Not registered does not mean explicit zero: both FOB components were actually registered as zero.
The inbound lane FAB-023 → CD-NOVO-001 uses a different calculation:
fleet CIF-DEDICADO has the PADRAO band from 0 to 10,000 km, with a
base component of 23.7626 per TON and 0.252 per TON/km. Using the
road distance of approximately 610.019851 km, its unit cost becomes:
23.7626 + 0.252 × 610.019851 ≈ 177.487602 per TON.
That last amount is calculated from the distance band; it is not a direct registered lane price. When checking transfer freight, retain the fleet, table, band, distance, and unit that produced the value together.
Check before continuing
A sample of every service reconciles origin, destination, fleet, table, validity, and unit. FOB delivery produces explicit zero cost; internal transfers remain costed.
Previous: 1. Segment markets and demand.