5. Create and connect candidate locations
What you will build
Turn proposals into master data with inbound and outbound lanes in each network version.
Before starting
Use the candidates and proximity pairs obtained in the previous chapter. Identify the plants or suppliers that can replenish each proposed DC.
Barycenter analysis returns proposals and proximity pairs; it does not automatically create locations or transportation lanes. Create the selected locations and turn outbound DC → region/customer pairs into lanes in each network version where they will be evaluated. Review their materials, fleets, distances, lead times, and costs.
The simulation owner must create inbound lanes from plants or suppliers: the tool does not yet propose those origins automatically. Coordinates and customer proximity do not make a DC replenishable. Check inbound and outbound connections before running.
For HUBs, specify the consolidation or transshipment role and allowed flows. For DCs, record costs and capacities consistent with receiving, storage, and shipping. For regions, retain the demand-point role. See the datasets in Transportation network.
Complete the supply path
- Select the proposals to evaluate and create each candidate as a distinct location, preserving the reviewed proposal's latitude and longitude. Record its DC role and the applicable costs and capacities.
- For each network version containing the candidate, use proximity pairs as a starting point for outbound lanes. Check destination, distance, and materials. Proximity proposes a connection; retain only customers whose service segment permits it.
- Associate the corresponding fleets and prices with these outbound lanes. Separate CIF and FOB shares: two locations in the same municipality can use the same physical facility while retaining distinct demand and cost rules.
- Manually create inbound lanes from plants or suppliers. Check materials available at the origin, fleet, transfer freight, and lead time. The customer-proximity file does not automatically provide this supply.
- Choose a material and trace origin → candidate → customer. Check that both lanes belong to the correct version and allow the material. Repeat for each candidate, then check the profile scope in the next chapter.
A candidate with outbound lanes but incomplete inbound connections can look well located on a map and still receive no product. A candidate with inbound connections but no eligible outbound lanes does not solve market service. Complete both sides before interpreting a facility-opening decision.
Apply this scenario's candidate
The chapter 4 proposal was registered as CD-NOVO-001, preserving latitude
-23.7656 and longitude -53.3201. In the evaluation network, 61 outbound
lanes were created from the barycenter pairs: 53 with CIF-FRACIONADO
and 8 with FOB-FRACIONADO, the latter with explicit zero unit and trip
costs. The inbound connection
FAB-023 → CD-NOVO-001 was registered separately by the study owner, with
CIF-DEDICADO and routed distance of approximately 610.02 km.
One concrete outbound connection is CD-NOVO-001 → MUN-2271-CD-CIF,
with 31.05 km. Annual demand for MAT-052 at this customer is 166 TON.
The barycenter shows 167.90 TON because it aggregates all selected
materials; align the material scope before comparing volumes.
Check both sides in the Explorer
Open Supply Network Explorer, select MALHA-BROWNFIELD, Location = MUN-2271-CD-CIF, Material = MAT-052, and Maximum Tree Depth = 2. Click Generate graph and check:
- CD-NOVO-001 → MUN-2271-CD-CIF, which turns the barycenter's service proposal into an eligible connection;
- FAB-023 → CD-NOVO-001, which completes the new DC's manually registered replenishment path.
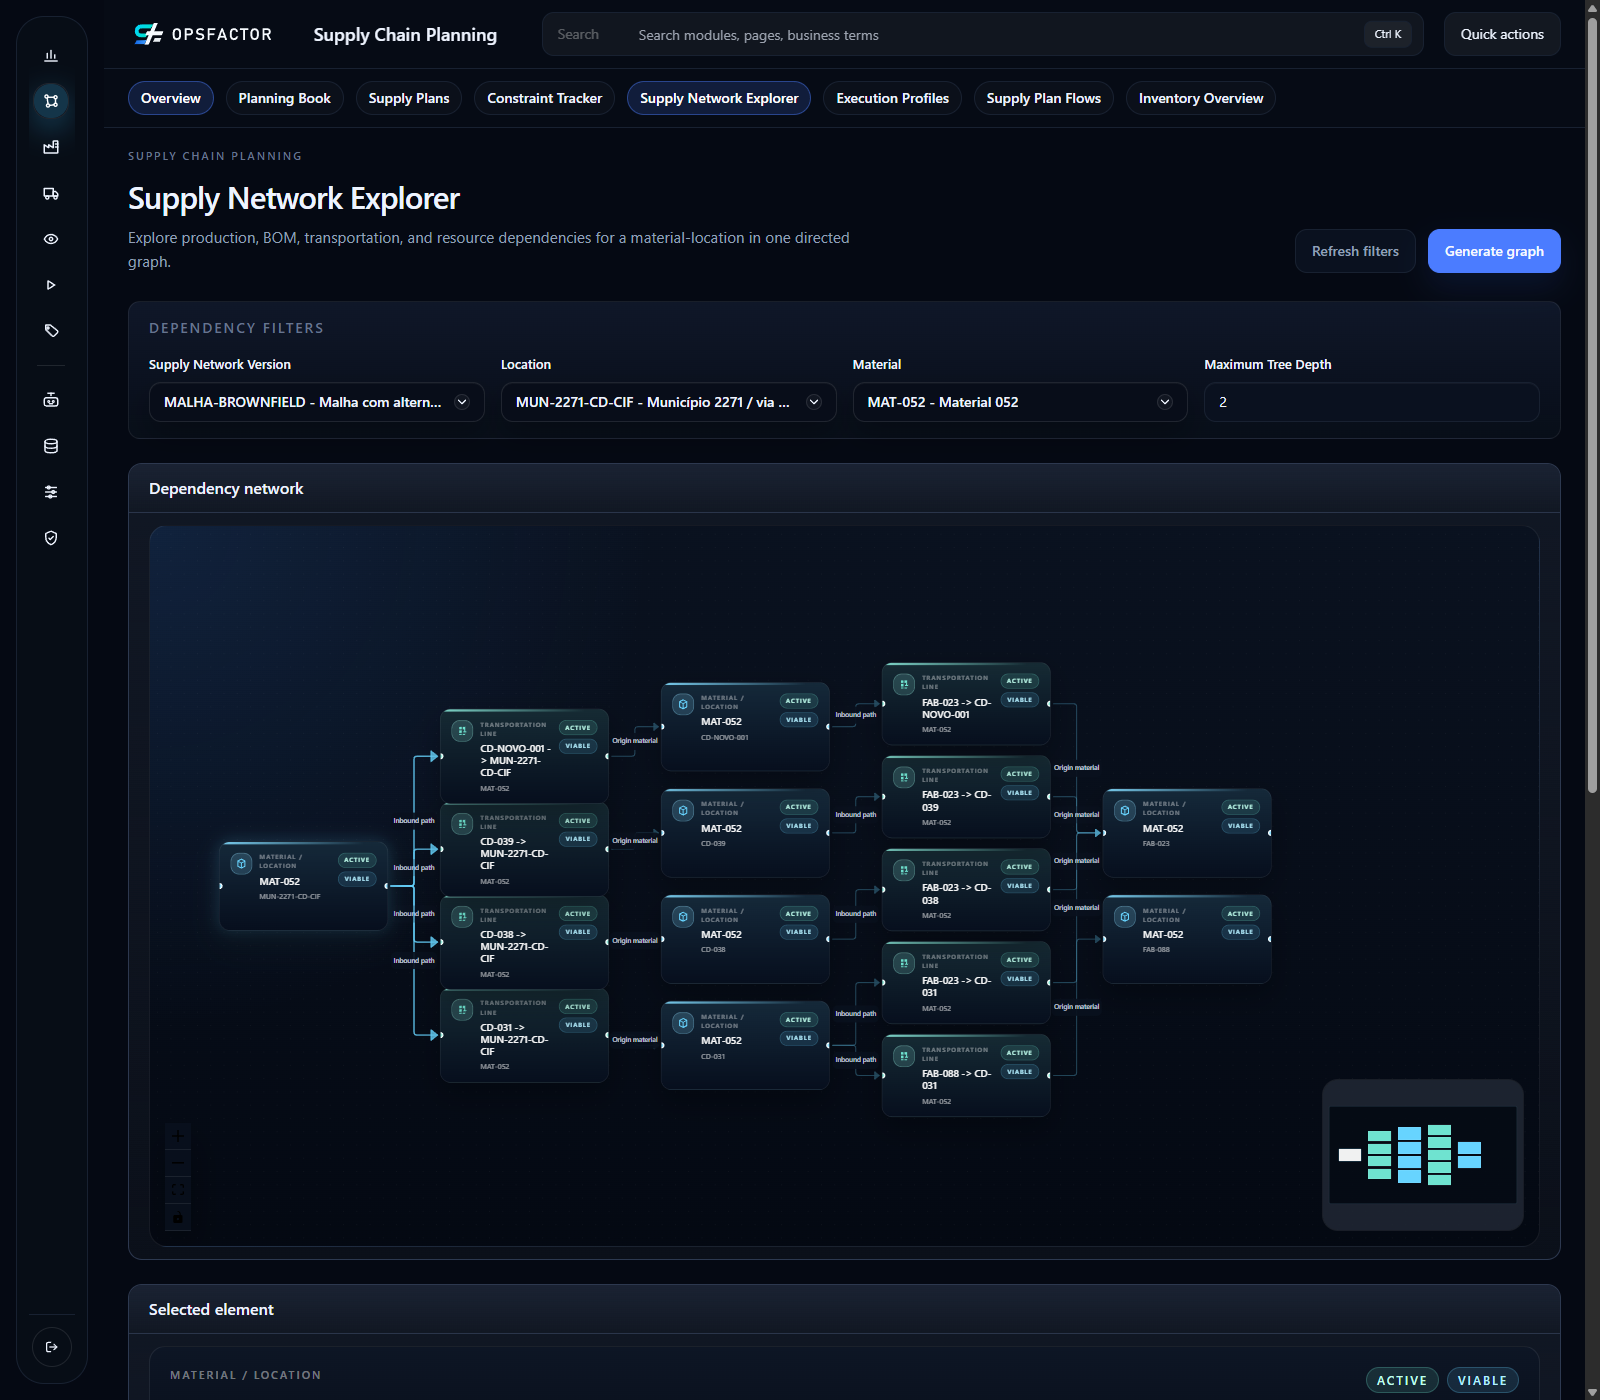
Lane names state the physical direction. The graph starts at the customer and expands its dependencies; its arrows do not reverse the registered transportation direction. The screen proves eligible connectivity, rather than the optimizer's final selection.
To compare operations, an existing DC in the same scope provided the fixed-cost assumption: 2,509,350.89 per year, with Yearly incidence, effective from 2026 through 2040. The scenario uses zero activation cost, without an implementation budget or CAPEX. Therefore, the comparison evaluates operating costs; it does not by itself support an investment recommendation or opening return. Replace that assumption with a validated budget before that decision.
After adding the new location to the master, also check profiles representing the existing network. Explicitly exclude CD-NOVO-001 from the baseline and flexible current-network profiles; its presence in master data must not add fixed cost or a facility to those scenarios. In the evaluation profile, include it in scope and make it optional, as explained in chapter 6.
Check before continuing
Every selected candidate exists in master data and has valid inbound and outbound lanes in the evaluated network. Materials, fleets, lead times, and costs are checked; no candidate is isolated.
Previous: 4. Propose DCs with barycenter analysis.