17. Open, analyze, and export the Supply Plan
Use the same Supply Plan in every screen and download. Record its description and numeric ID before starting: comparing screens from different plans is a common source of false discrepancies.
Open the Supply Planning Book
Open Supply Chain Planning > Planning Book, select the plan completed in chapter 16, choose the configured Community view, and load it. Start with one finished good and location, then compare:
- Unconstrained Plan: requirement before the productive-capacity limit;
- Constrained Plan: feasible heuristic result after the enabled constraints;
- Working Plan: version selected in the execution profile for operational review;
- inventory, production, inbound, direct demand, and safety-stock key figures for the same material, location, period, and UOM.
Do not add intermediate roll or skid quantities to finished-goods production. They are different levels of the same transformation chain.
Open Production Overview
Open Production Planning > Production Overview.
- Select the same Supply plan version.
- Select TON in Unit of measure.
- Click Open Dashboard.
- Leave locations and materials empty for the whole plan, then narrow the scope only after the totals load.
The first charts compare stock, demand, inbound, and production. Below them, Production volume / Occupation puts available and allocated capacity on the primary axis and production volume on the secondary axis. Compare Constrained with Unconstrained; they answer different questions.
Examine a bottleneck by clicking an occupation percentage
In Occupation by Production Resource - Constrained, scan the monthly percentages. Cells above 80% are highlighted as a warning; cells at 99.9% or more use the overload color. For this tutorial, start with a South production resource at its highest constrained month: that is the bottleneck candidate.
Click the percentage itself. The page opens Production Resource Detail below the two occupation grids for exactly one resource and one period.
Read the header first:
| Field | Interpretation |
|---|---|
| Production line | resource whose percentage was clicked |
| Location | physical site that owns the resource |
| Period | bucket represented by the clicked column |
| Available hours / capacity | denominator used for the resource-period capacity view, in the displayed capacity UOM |
Then inspect the allocation rows:
| Field | Interpretation |
|---|---|
| Material / Description | output consuming the selected resource |
| Production version | eligible combination used to produce the output |
| Routing | process path that contains the resource |
| BOM | component structure associated with that production choice |
| UOM | unit of the output quantities |
| Unrestricted qty / consumption | unconstrained production and its capacity consumption |
| Restricted qty / consumption | constrained production and consumption after capacity leveling |
| Work plan qty / consumption | values published in the Working version |
| Capacity UOM | unit for consumption and available capacity; do not add it to the output UOM |
For the candidate bottleneck, reconcile the percentage as
restricted consumption ÷ available capacity × 100 across the detail rows.
The displayed percentage is an aggregate for the resource-period; the table
explains which outputs, versions, routings, and BOMs consume it.
An Unconstrained value above 100% is diagnostic: it shows the capacity that would be required without the enabled productive constraint. A Constrained value above 100% is different and must be investigated. Check unit, period, capacity record, selected filters, and whether the same physical resource is being duplicated. Do not call an isolated idle line "available capacity" when another resource on the complete roll → skid → finished-good route is saturated.
Export the result bases
Open Data > Operations > Data Operations. Under Planning Data > SNP - Supply Network Planning, select each topic, choose Download, select the same Supply Plan, and download XLSX or JSON.
| Topic | What to validate |
|---|---|
| Fulfilled Demand > Fulfilled Demand for Supply Plan | reference demand, unconstrained demand, fulfilled quantity, unmet quantity, fulfillment rate, period, location, material, and UOM |
| Purchase/Distribution Plan > Purchase/Distribution Plan | origin, destination, expedition/receipt period, material, quantity, UOM, plan version, and whether the movement is purchase or transfer |
| Production Plan > Production Plan - Volumes | production location, output material, period, version/routing context when present, plan series, quantity, and UOM |
| Production Plan > Production Plan - Resource Occupation | location, resource, period, series, capacity consumption, capacity UOM, and production reference |
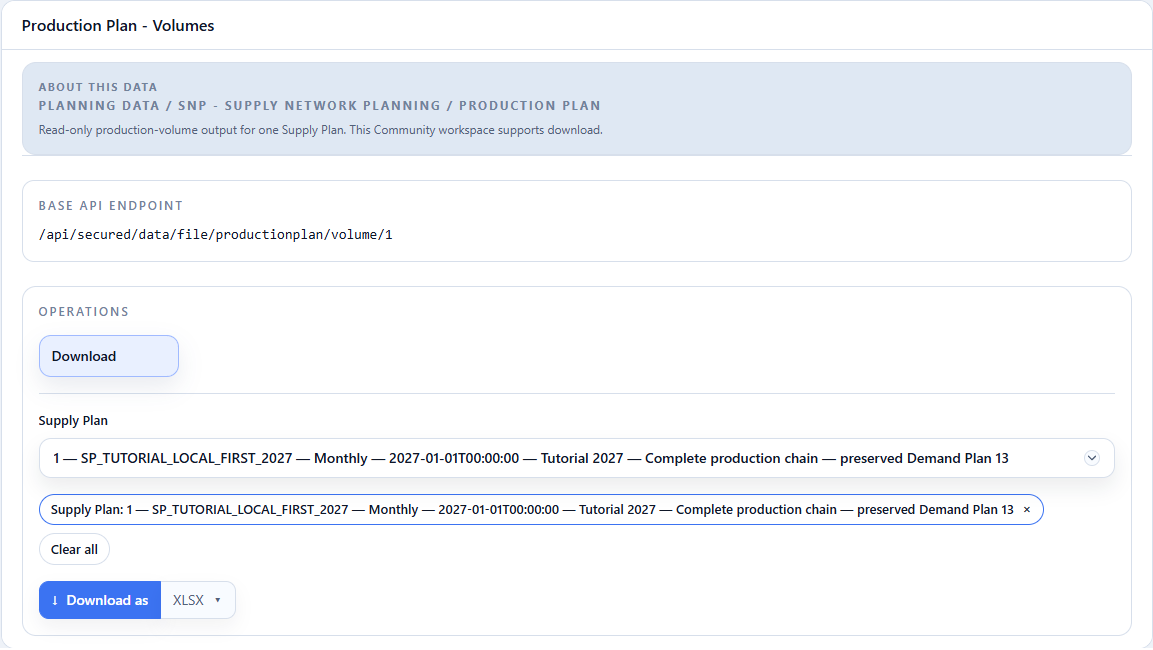
For Fulfilled Demand, verify the identity
reference demand = fulfilled demand + unmet demand at the same grain and UOM.
Do not mix direct market demand with propagated component demand. For
distribution, confirm that a transfer destination matches the corresponding
inbound location and period after lead time. For production, reconcile volume
with the material rows in the resource detail; reconcile occupation with the
consumption columns, not with TON unless the resource capacity itself uses TON.
Completion criterion
Complete the tutorial when you can reopen one plan in Supply Plans and the Planning Book, identify and explain one constrained bottleneck in Production Overview, and export all four bases for that same plan without mixing IDs, series, periods, or units.
Return to the complete tutorial map.