7. Run the Demand Plan
In the previous chapters, you loaded the data, created the clusters, created a 12-period monthly calendar and linked it to the execution profile, and configured and validated the statistical models. We will now use that setup to generate a new Demand Plan initialized with a forecast from January through December 2027.
How the setup forms the Demand Plan
flowchart LR
  P["PD_MENSAL_TUTORIAL<br/>Monthly bucket · 12 periods"]

  subgraph WP["Papel branco"]
    direction LR
    WCFG["Default Location Cluster<br/>×<br/>Produtos acabados de papel branco"]
    WAGG["Papel branco<br/>aggregate forecast"]
    WSPLIT["Historical Sales<br/>top-down split"]
    WDFU["48 material-location<br/>DFU forecasts"]
    WCFG --> WAGG --> WSPLIT --> WDFU
  end

  subgraph TI["Tissue"]
    direction LR
    TCFG["Default Location Cluster<br/>×<br/>Produtos acabados de papel tissue"]
    TAGG["Tissue<br/>aggregate forecast"]
    TSPLIT["Historical Sales<br/>top-down split"]
    TDFU["12 material-location<br/>DFU forecasts"]
    TCFG --> TAGG --> TSPLIT --> TDFU
  end

  PLAN["Demand Plan<br/>January–December 2027<br/>60 DFUs × 12 months = 720 values"]

  P --> WCFG
  P --> TCFG
  WDFU --> PLAN
  TDFU --> PLAN

  classDef context fill:#f8fafc,stroke:#64748b,color:#0f172a,stroke-width:2px;
  classDef config fill:#e8f4f8,stroke:#0ea5e9,color:#0f172a,stroke-width:2px;
  classDef forecast fill:#dbeafe,stroke:#3b82f6,color:#0f172a,stroke-width:2px;
  classDef dfu fill:#ecfeff,stroke:#06b6d4,color:#0f172a,stroke-width:2px;
  classDef result fill:#dcfce7,stroke:#16a34a,color:#0f172a,stroke-width:3px;

  class P context;
  class WCFG,TCFG config;
  class WAGG,WSPLIT,TAGG,TSPLIT forecast;
  class WDFU,TDFU dfu;
  class PLAN result;
The profile uses the monthly bucket and 12-period horizon from the calendar defined in chapter 5. January 2027 is selected as the reference when running the process. Each of the two configurations first generates the aggregate forecast for its material cluster. The top-down split then uses Historical Sales proportions to distribute those values across material-location DFUs: 48 for Papel branco and 12 for Tissue. The result combines 60 DFUs across 12 months, or 720 monthly values, in one Demand Plan.
The runtime screenshots use Portuguese example names. Identify the profile
by PD_MENSAL_TUTORIAL and the plan by its January 2027 reference; the
interface controls keep their English labels.
1. Open Process Execution
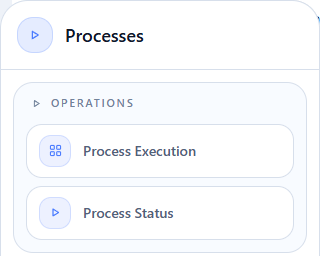
Hover over Processes in the side menu and open Operations > Process Execution.
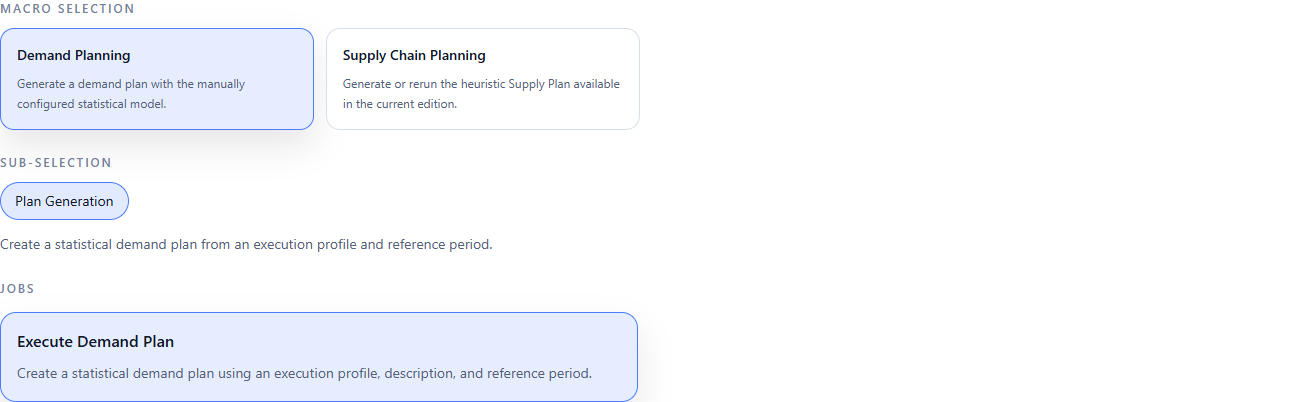
On the open page, make the three selections in the order shown below.
Action to perform
- Under Macro Selection, select Demand Planning.
- Under Sub-selection, select Plan Generation.
- Under Jobs, select Execute Demand Plan.
These selections open the execution options that generate the statistical plan.
2. Fill in the execution fields
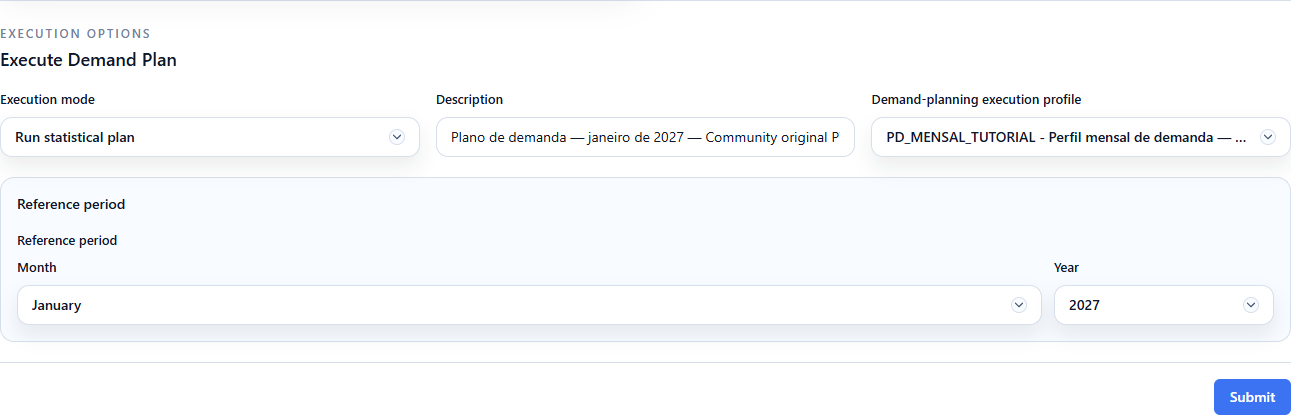
The same page presents the description, profile, and reference period. Fill in the controls below before submitting the run.
Action to perform
- Under Description, enter
Plano de demanda — janeiro de 2027 — Community 2026.09.22 PT. - Under Demand-planning execution profile, select
PD_MENSAL_TUTORIAL. - Under Reference period, select
Januaryand2027. - Click Submit.
In Community Edition, Submit runs the Demand Plan synchronously: the page waits for the completion response before enabling another interaction.
3. Follow the execution and confirm completion
Right after you click Submit, the button changes to Processing… and becomes unavailable. This state shows that the execution has started and that this page is waiting for the completion response.
When the request finishes, the button returns to Submit and the page shows Execute Demand Plan submitted — Demand Planning executed successfully. This notification confirms that the Demand Plan completed successfully.
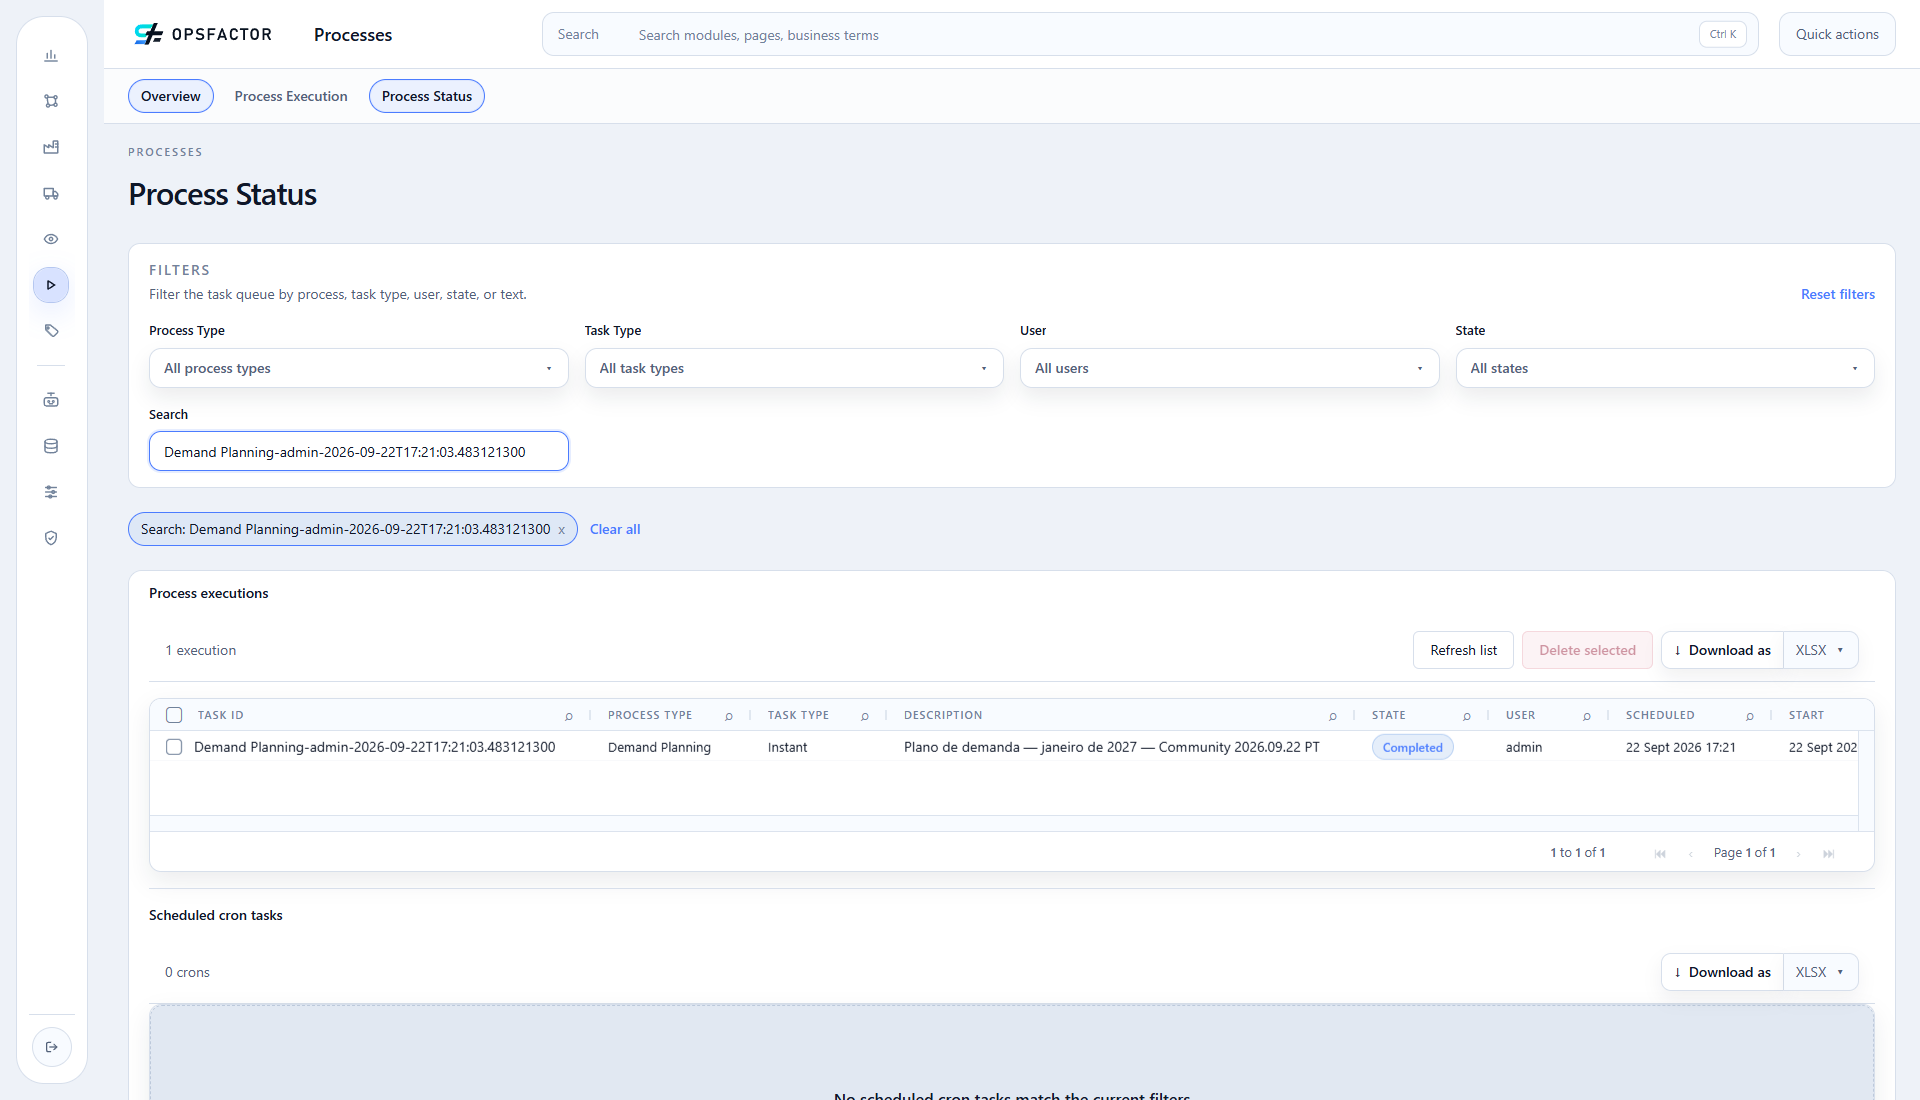
You do not need to remain on this page. If you navigate away or close it before completion, the job continues to run. Open Processes > Process Status to follow the execution and check its final state even after leaving the execution page.
How to read the status
Processing… means that this page is still waiting for the execution response. Leaving this page does not cancel the job: use Process Status to follow its progress and confirm the success message or final state before running it again.
4. List Demand Plans
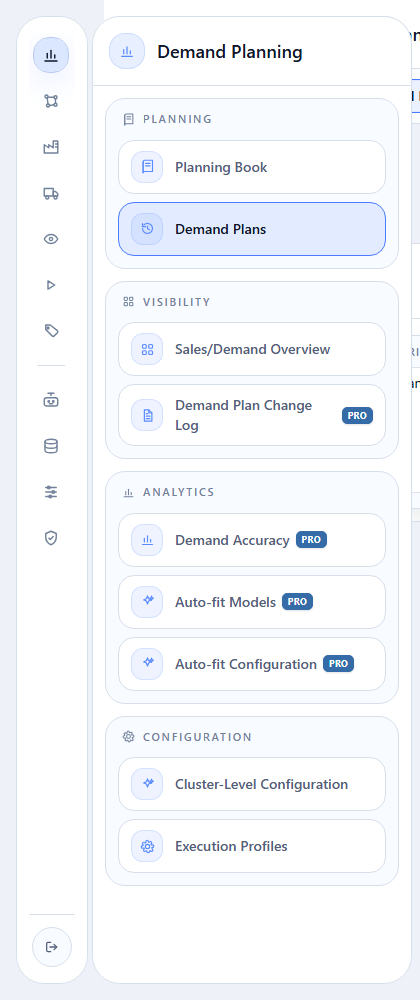
Hover over Demand Planning and open Planning > Demand Plans.
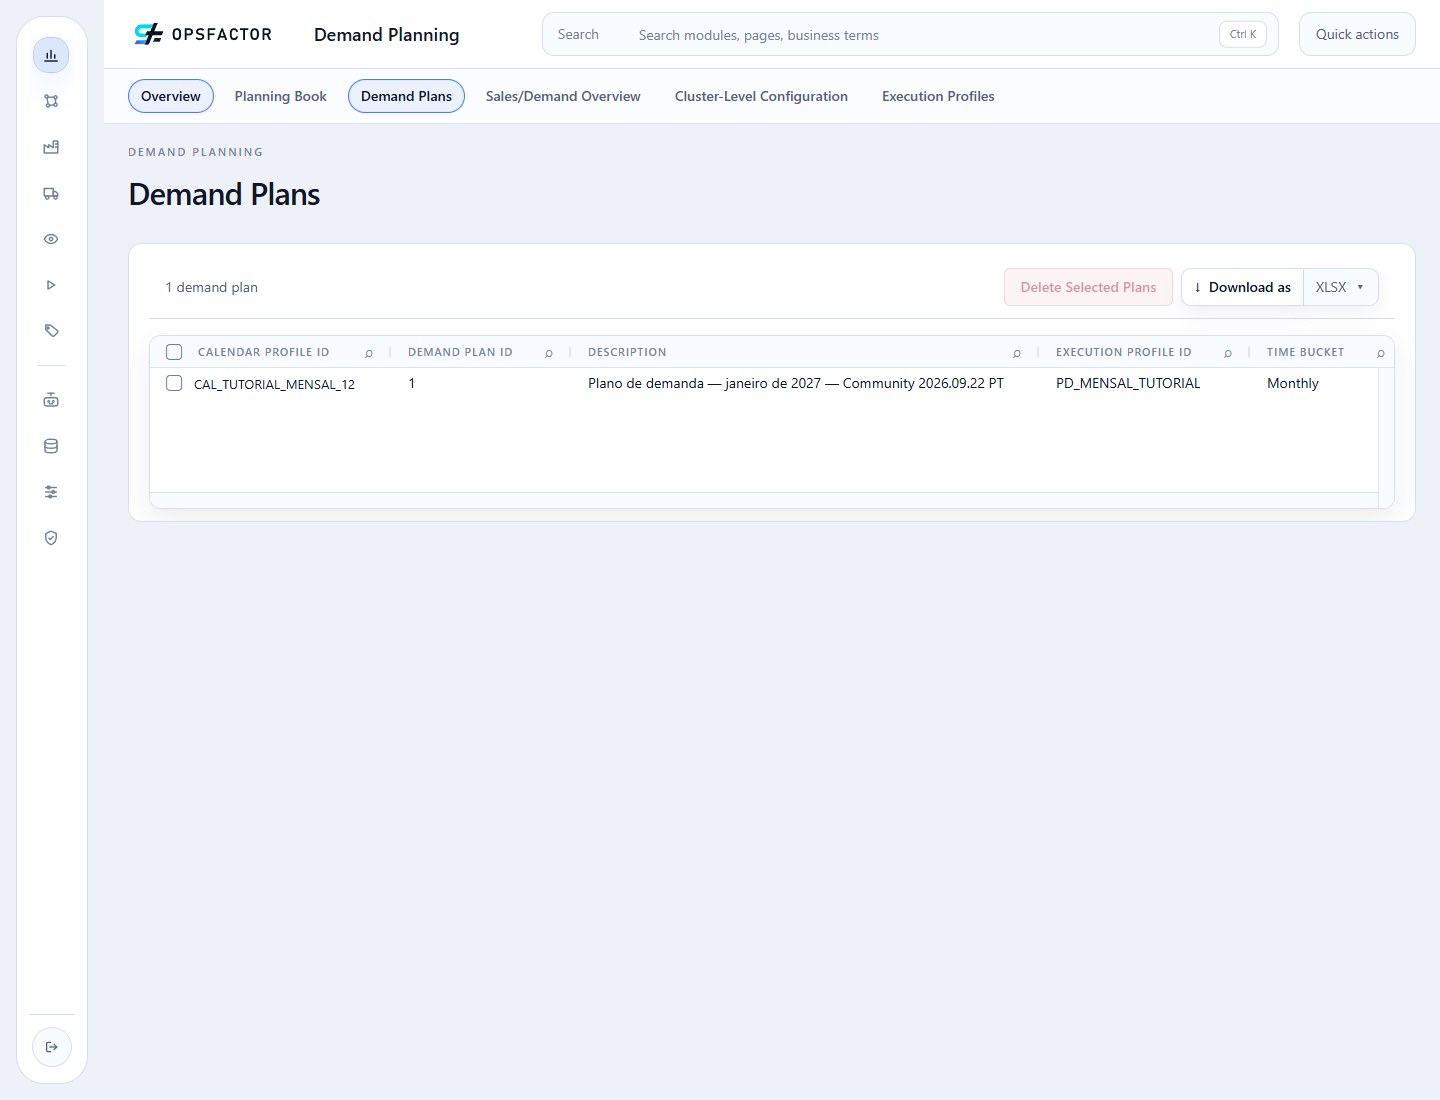
The row created by the execution shows the description, monthly profile, January 1, 2027 reference date, and functional user.
What we did
- ran
PD_MENSAL_TUTORIALwith January 2027 as the reference period; - generated 60 DFUs for the 12 months from January through December 2027;
- persisted 720 monthly values in a versioned and traceable Demand Plan.
Completion criterion
You have completed this chapter when the scenario appears under Demand
Plans with PD_MENSAL_TUTORIAL, a monthly bucket, a January 2027 reference
period, and the user who launched the execution.
Continue with the commercial collaboration view, or revisit the execution profile if the scenario parameters do not match.