Inventory policies and optimization
An inventory policy defines how a material-location is replenished and protected. It may combine safety stock, maximum or Kanban stock, replenishment frequency, lot constraints, priority, and validity dates.
OpsFactor separates the current policy, consumed by Supply Planning, from a simulated policy, which remains a candidate until it is reviewed and copied into the operating configuration.
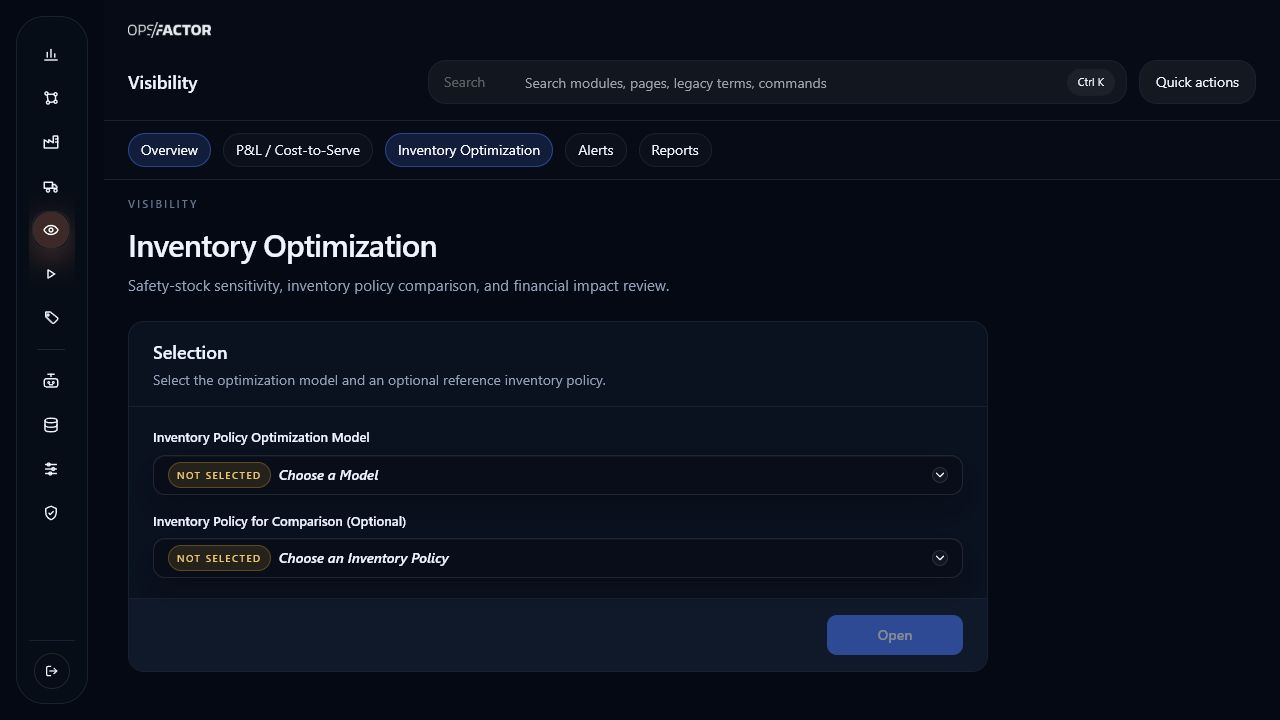
Path in the platform
Visibility → Inventory Optimization
Why fixed ABC targets are insufficient
A traditional rule such as “A items receive 98% service, B items 95%, and C items 92%” is easy to govern but ignores the behavior of each product at each distribution center. Two A items may have completely different demand variability, lead time, supply reliability, margin, storage cost, and obsolescence risk.
Inventory Optimization evaluates those local differences. The decision moves from defending one service target to presenting the economic consequences of alternative positions.
Monte Carlo policy simulation
The optimizer creates candidate safety-stock or coverage policies and uses repeated stochastic simulations to represent different future demand and replenishment paths. For each material-location and candidate policy, it estimates outcomes such as:
- average and peak inventory;
- service and fulfilled demand;
- backlog or lost sales;
- replenishment quantities and timing;
- aging and write-off when shelf life applies;
- the average economic impact across samples.
This is a Monte Carlo decision process, not a global Supply Planning MIP. The result should be read as a sensitivity curve: how risk, service, and cost change as inventory protection increases.
Financial objective
The financially preferred policy can combine:
- lost sales measured by estimated EBITDA or contribution margin;
- cost of capital applied to average inventory;
- storage and handling cost;
- write-off, loss, or obsolescence cost;
- replenishment economics and other configured impacts.
More safety stock usually reduces shortage exposure but increases capital and carrying costs and may increase obsolescence. The recommended point is the lowest expected total impact under the loaded assumptions; when impacts tie, the lower coverage is preferred.
The planner does not need to defend inventory simultaneously against Finance and Sales using separate narratives. The team can present one curve and let decision owners choose where to position the organization on the trade-off.
Days and quantity are different policies
DAYSconverts coverage into quantity using demand or consumption over the planning calendar.QUANTITYis already a physical amount.
Always confirm the unit before comparing policies. Ten days and ten units are not equivalent.
Inputs and connections
- Inventory policy
- Inventory positions
- Released Demand and sales history
- Transportation network, lead times, lots, and replenishment type
- Prices, COGS, and economic parameters
- Economic decision data model
Recommended journey
- Reconcile the current policy and its unit.
- Segment material-locations by service criticality, demand pattern, replenishment, and obsolescence risk.
- Confirm demand samples, lead time, supply reliability, lot rules, costs, and horizon.
- Simulate multiple candidate coverages.
- Read service, inventory, lost sales, storage, capital, and write-off together.
- Investigate discontinuities caused by lots, long lead times, or sparse demand.
- Review the recommended policy with Planning, Finance, Commercial, and Operations.
- Copy an approved candidate to the operating policy and monitor realized behavior.
How to challenge a recommendation
If a result looks surprising, verify policy unit, effective demand, lead time, fill rate, sample count, lot and multiple, backlog versus lost-sales behavior, shelf life, item value, margin, capital rate, and storage cost. A recommendation is only as reliable as the scenario definition.
Edition comparison
| Capability | Community | Pro / Enterprise |
|---|---|---|
| Inventory policies consumed by Supply Planning | Included | Included with managed governance and scale |
| Basic inventory and coverage reading in the Supply Plan | Included | Included with advanced analysis |
| Monte Carlo candidate-policy simulation | Not included | Pro / Enterprise |
| Financially optimal safety-stock policy | Not included | Pro / Enterprise |
| Lost EBITDA, capital, storage, and obsolescence trade-off | Not included | Pro / Enterprise |
| Aging, shelf life, and write-off sensitivity | Not included | Enterprise when applicable |
| Approval and copy of simulated policy | Not included | Pro / Enterprise with governed workflow |
For the economic intuition, read how much service another day of coverage is worth and how to move from target to executable policy.